While Bitcoin has lost almost 80% of its value since its all-time high, some analysts already seem to be updating their historical indicators. Indeed, such a fall in Bitcoin is not new and still resonates as an opportunity for many investors. Still, assurance of a Bitcoin low is still a long way off.
Thus, the magnitude of the recent decline tends to reinforce the hypothesis of durable maintenance of Bitcoin on major supports. However, this does not guarantee that the world's leading cryptocurrency will not drop further to new lows that would challenge the long-term market development.
In this bearish context where volatility is raging, discover in this article the 8 indicators that preceded a historic low for Bitcoin (BTC).
The Correlation of Bitcoin to Stocks
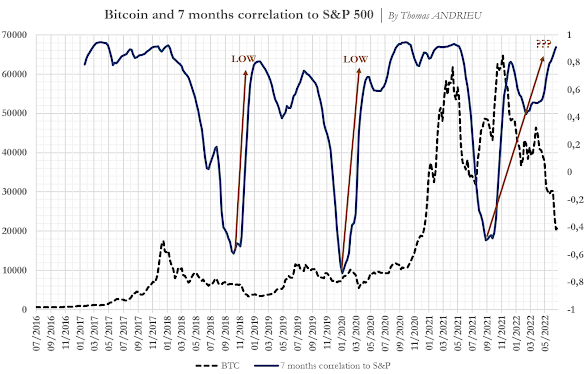
One of the simplest observations is to recall Bitcoin's strong long-term correlation to the stock market. We have represented below the price of Bitcoin in dotted lines, and the 7-month correlation between Bitcoin and the S&P 500 in blue. We then notice that the phases of Bitcoin's decline respond to a fairly precise correlative pattern.
Every all-time Bitcoin low has been preceded by a low in Bitcoin's correlation to stocks. This low was then confirmed when the correlation between equities and Bitcoin reached a new high.
Correlation chart of Bitcoin price and S&P500 index price from July 2016 to May 2022
This was the case between January 2018 and the end of 2018, between mid-2019 and January 2020, or even between March 2021 and September 2021. Secondly, the fall in the price of Bitcoin can become more violent and results in a phase of “re-correlation” to stocks. This phenomenon can be explained statistically: Bitcoin is an asset that can be estimated to be up to 5 times more sensitive to cash than stocks.
Thus, Bitcoin reacts by anticipation, then by mimicry to actions in its downward phase. Finally, it generally validates a historical low. Currently, we are close to a new correlation high which would confirm the first stop of the downtrend.
Track holders' wallets: detect Bitcoin accumulations
Historically, bullish phases in the price of Bitcoin have been driven after a significant phase of accumulation. Conversely, the decline of Bitcoin is generally synonymous with a distribution of Bitcoins in circulation from long-term portfolios (2 to 5 years) to medium-term investors (a few months).
The chart below, taken from Glassnode, shows the distribution of Bitcoins in circulation based on how long Bitcoins have been held in the wallet.
Graph illustrating the distribution of Bitcoins in circulation according to the duration of the holding of BTC in the portfolio
We thus note that the capitulation phase, which results in a major low in the price of Bitcoin, is also synonymous with maximum selling pressure from long-term investors and the absence of buying short-term investors.
To date, short-term investors have partially retreated while long-term investors have accelerated their selling in May and June. Nevertheless, we cannot overlook the influence of very long-term carriers, who do not seem to have changed their position despite the recent crisis.
Moving averages: “impassable floor”?
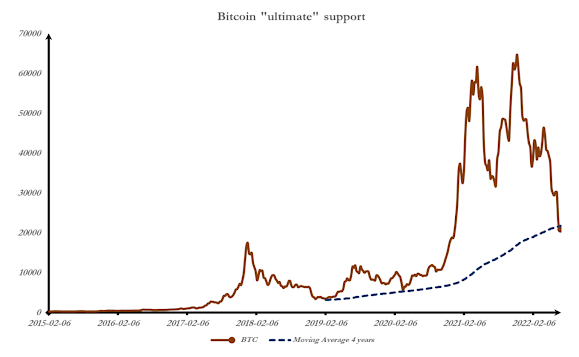
Another way to determine Bitcoin's "ultimate" support is to use moving averages. Indeed, several studies show that the dominant cycle of Bitcoin is a cycle between 4 and 5 years. This means that it is statistically unlikely that Bitcoin will go back below its pre-4-5 year levels. Thus, we can clearly see that the 4-year moving average, represented in blue on the graph below, has framed all the major low points since 2019.
4-year Bitcoin price moving averages
However, it is not impossible that Bitcoin overflows slightly under this mobile support. But a lasting crossing of the 4-year moving average, whose level is $21,700 at the end of June 2022, would call into question the long-term evolution of Bitcoin observed so far.
Will the “stock to flow” model of cryptos still be successful?
Stock to flow is a fairly well-known model in the crypto universe. Its calculation is relatively simple: we divide the already existing stock of Bitcoins by the annual flow of new Bitcoins. This model is also used in traditional finance, in particular, to assess the market's ability to absorb supply and to attempt to provide price projections.
Evolution of BTC prices between 2012 and 2022 with the value of the stock to flow
Source: lookintobitcoin
The graph above shows us the price of Bitcoin (in logarithmic scale) with the stock-to-flow value in red. The bottom index shows us the variance between the two curves, ie the difference observed. So far, the two curves have always been very close and the model has remained fairly accurate in describing the structural evolution of the Bitcoin price. However, in recent months there has been a historic gap between the price of Bitcoin and this model.
In the optimistic scenario, it will be recalled that most of Bitcoin's major low points were validated between two halvings (two “Stock to Flow” plateaus ). In this scenario, a bullish signal in 2022 or 2023 would be a strong long-term signal. Nevertheless, the recent divergence with the model prompts us to be cautious.
Bollinger bands: the statistical indicator
Bollinger bands are a technical indicator that allows you to visualize the statistical evolution of the asset. A Bollinger band is made up of a central line that corresponds to the moving average, and two extreme lines which are calculated from the volatility of Bitcoin. Thus, it is rare for Bitcoin to exceed these extreme lines: these are the “bands” of Bollinger.
Bitcoin price evolution analyzed with Bollinger bands
Source: Tradingview
We indeed observe that all the last historical low points of Bitcoin were validated when the price of Bitcoin came out of the extreme bands of Bollinger. The same is true for vertices. However, this low point is generally not validated until the price of Bitcoin has recrossed the moving average in yellow on the graph above. An aggressive investor can therefore act according to the extreme bands, but the moving average leaves the possibility of controlling his risk.
Bitcoin volatility: detecting reversals through psychology
Measuring Bitcoin volatility is another way to anticipate certain trends. Indeed, Bitcoin is one of the most volatile assets in the financial world. This is where the alternation between the feelings of "fear" and "euphoria" is strongest.
This reflects the fact that the Bitcoin price is statistically very unstable. In addition, the volatility measurement shows us that the average volatility recorded on Bitcoin is around 60% (compared to 20% for the CAC 40 for example).
Chart of Bitcoin volatility from January 2017 to January 2022
During phases of rising Bitcoin prices, we generally observe an increase in its volatility. Conversely, during bearish phases, the volatility of Bitcoin tends to decrease. Recently, Bitcoin's decline has not been accompanied by a decrease in its volatility.
This may be a sign that Bitcoin's upside rebound potential is narrowing from past lows . In any case, this phenomenon reflects the fact that the recent decline of Bitcoin is neither extreme nor normal, and that Bitcoin tends to acquire a certain "stability" of its variations.
The correlation coefficient and Bitcoin dominance: anticipating market phenomena
Bitcoin dominance or dominance represents the capitalization of Bitcoin relative to the capitalization of the entire cryptocurrency market. Traditionally, it is observed that the rise of Bitcoin leads to a sometimes greater rise in other crypto-currencies, which implies a decrease in the “dominance” of Bitcoin. Bitcoin represented 70% of the cryptocurrency market in December 2020, compared to 40% in January 2022.
Evolution of Bitcoin's dominance over other cryptocurrencies between 2014 and 2022
Source: CoinMarketCap
This chart from CoinMarketCap illustrates our point. In 2018, Bitcoin had even fallen to the dominance of 32.5%. However, the recent drop in the price of Bitcoin has only led to a very slight revival of interest in the world's leading cryptocurrency. This observation is in line with the observation relating to volatility.
It is possible that Bitcoin's rebound potential is more limited than in the past. Nevertheless, we note that the loss of dominance of Bitcoin is a historical trend. Thus, a major bitcoin price low could have less difficulty in validating than in the past at current levels of capitalization.
The Bitcoin halving: an unmissable ceremony in the virtual currency market
The halving is an event that occurs approximately every 4 years and consists of halving the remuneration of miners. The goal is to gradually reduce the money creation associated with Bitcoin and ensure the long-term scarcity of Bitcoin supply. The next halving is expected to occur by 2024.
Historically, major Bitcoin lows take effect between two halvings. Conversely, most bull markets started after a halving. This hypothesis supports the idea that Bitcoin is experiencing a characteristic decline in its temporality. The challenge will indeed be to observe, or not, the rebound of Bitcoin before the next halving, that is to say before the end of 2023.
What is the future of Bitcoin?
Ultimately, many indicators show that Bitcoin is still in a pronounced bearish phase. However, in view of most of the indicators we have, Bitcoin could well mark a pause in this phase of the crisis. Nevertheless, there is no indication that the cryptocurrency will not continue its trajectory towards new lows which would then challenge the structure of the long-term market.
In terms of timing, we can effectively highlight a three-month bearish cycle that has been affecting the price of Bitcoin since 2021. In this sense, a decrease in downward pressure could appear by the end of summer 2022, so the entry into the current bearish cycle took place in May.
In any case, the validation of a low point will not be enough to trigger a rapid uptrend. As we have shown, Bitcoin is still very exposed to market turbulence and its rebound potential may be statistically reduced.
Disclaimer:
All of our information is, by nature, generic. They do not take into account your personal situation and do not in any way constitute personalized recommendations with a view to carrying out transactions and cannot be assimilated to a financial investment advisory service, nor to any incentive to buy or sell instruments.


0 Comments